Attaching package: 'dplyr'The following objects are masked from 'package:stats':
filter, lagThe following objects are masked from 'package:base':
intersect, setdiff, setequal, union
Attaching package: 'janitor'The following objects are masked from 'package:stats':
chisq.test, fisher.test
Attaching package: 'MASS'The following object is masked from 'package:dplyr':
select
Attaching package: 'gridExtra'The following object is masked from 'package:dplyr':
combinelibrary(purrr)
thm <-
theme_minimal() + theme(
panel.background = element_rect(fill = "#f0f1eb", color = "#f0f1eb"),
plot.background = element_rect(fill = "#f0f1eb", color = "#f0f1eb"),
panel.grid.major = element_blank()
)
theme_set(thm)
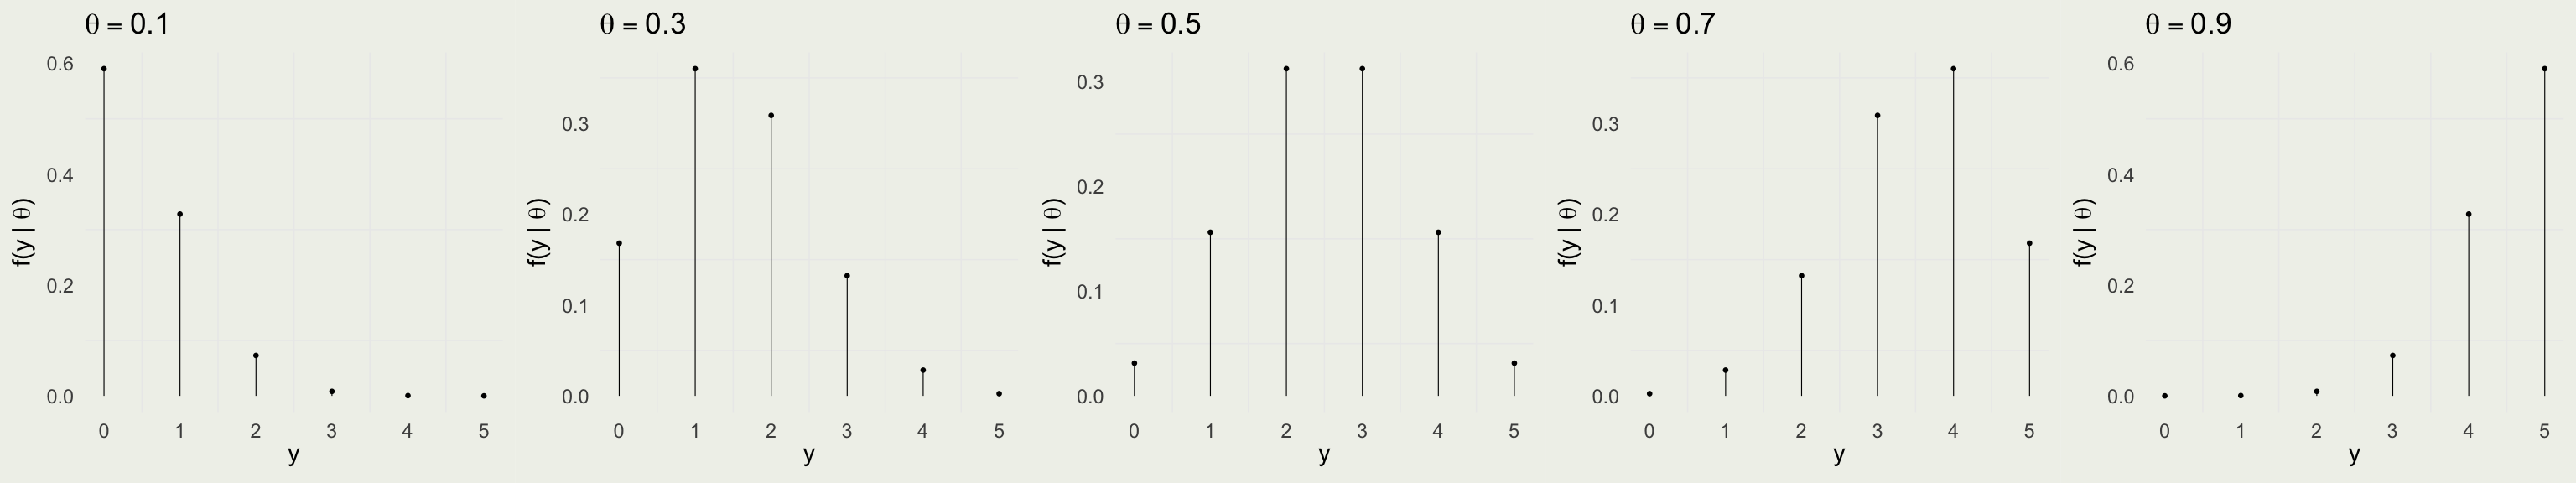
dbinom_theta <- function(theta, N, y) {
choose(N, y) * theta^y * (1 - theta)^(N - y)
}
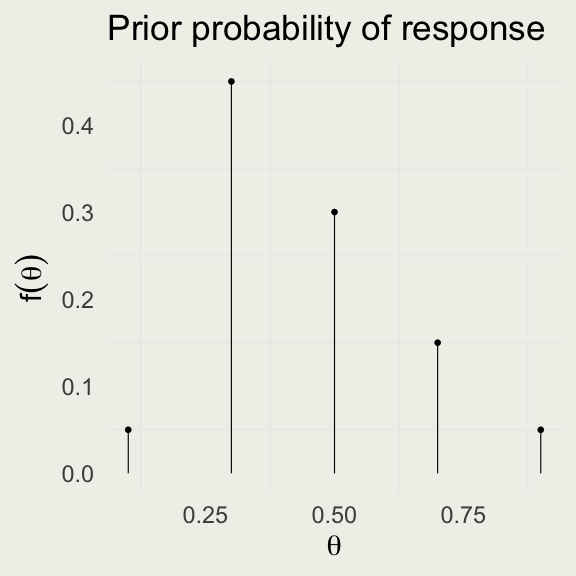
dot_plot <- function(x, y) {
p <- ggplot(data.frame(x, y), aes(x, y))
p + geom_point(aes(x = x, y = y), size = 0.5) +
geom_segment(aes(x = x, y = 0, xend = x, yend = y), linewidth = 0.2) +
xlab(expression(theta)) + ylab(expression(f(theta)))
}

 “Untergang der Titanic”, as conceived by Willy Stöwer, 1912
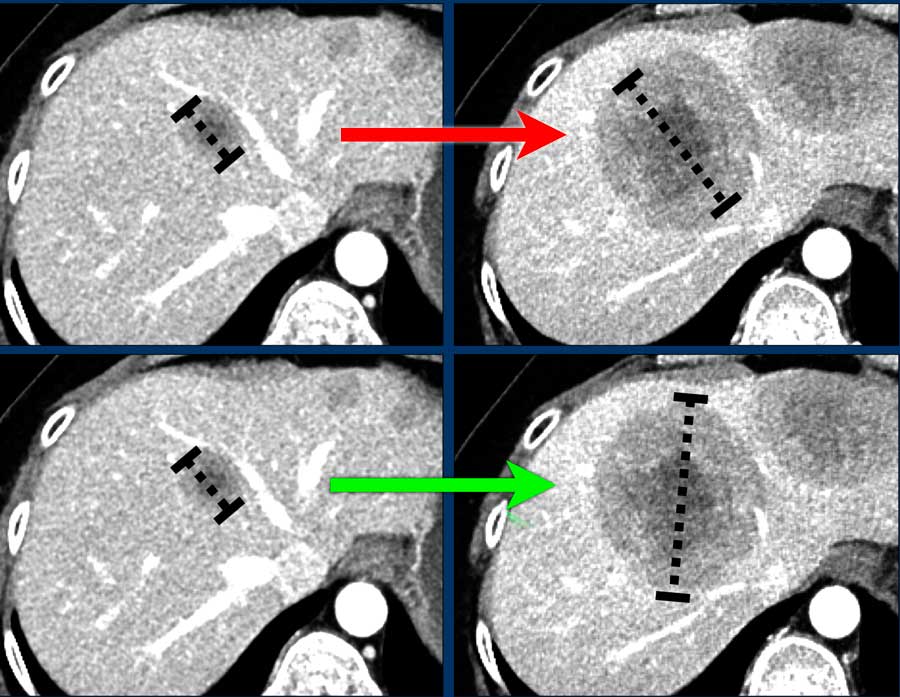 Image from Fokko Smits, Martijn Dirksen, and Ivo Schoots: